
SciMaps guide
Bibliometric Analysis: From Literature Collection to Results
Published by SciMaps · Updated
Plan a bibliometric analysis of a defined literature collection, choose network methods and report results with coverage and interpretation limits.
Start with a question and a defined collection
Bibliometric analysis summarizes publication metadata and relationships in a literature collection. It can help you describe a topic, compare reference contexts or inspect collaboration patterns. A map is a way to navigate evidence; reading the papers remains necessary to understand their claims.
Write down the research question, search terms, inclusion rules, time window and source coverage before interpreting results. A selected collection is the set you actually analyze, which may be smaller than your project or search results.
A practical task sequence
- Find candidate papers through research discovery, then add relevant sources to a literature project.
- Review titles, identifiers, dates, authors and references. Resolve inclusion decisions before selecting the papers for analysis. Do not assume missing metadata means a relationship is absent.
- Use Descriptives to inspect the collection. Choose a network method for the relationship you want to investigate.
- Inspect the map alongside its available tables, paper context, coverage and settings. Record thresholds and selection limits.
- Review the supporting papers and prepare a report that states the collection, method and limitations.
Choose the relationship you need
- Direct Citation: available citing-to-cited links between papers in scope.
- Bibliographic Coupling: papers connected by references they share.
- Co-citation: selected cited works connected when selected papers cite them together; paper mapping is restricted to the retained analytical corpus.
- Keyword Co-occurrence and Thematic Map: terms linked by shared occurrence, then clusters compared through centrality and density.
- Co-authorship: authors linked through shared papers.
Illustrative example
Suppose you select 40 papers about urban heat adaptation, published in a stated period, after checking the inclusion rules. A keyword network may show “heat” and “vegetation” as nodes connected because they occur in the same records. That link is evidence of term co-occurrence in these 40 papers, not proof that vegetation caused an outcome. Changing the selected papers or frequency threshold can change the map.
Four-paper example you can reproduce
This separate example uses synthetic teaching data, not real publications or research findings. The four records make the citation direction easy to check:
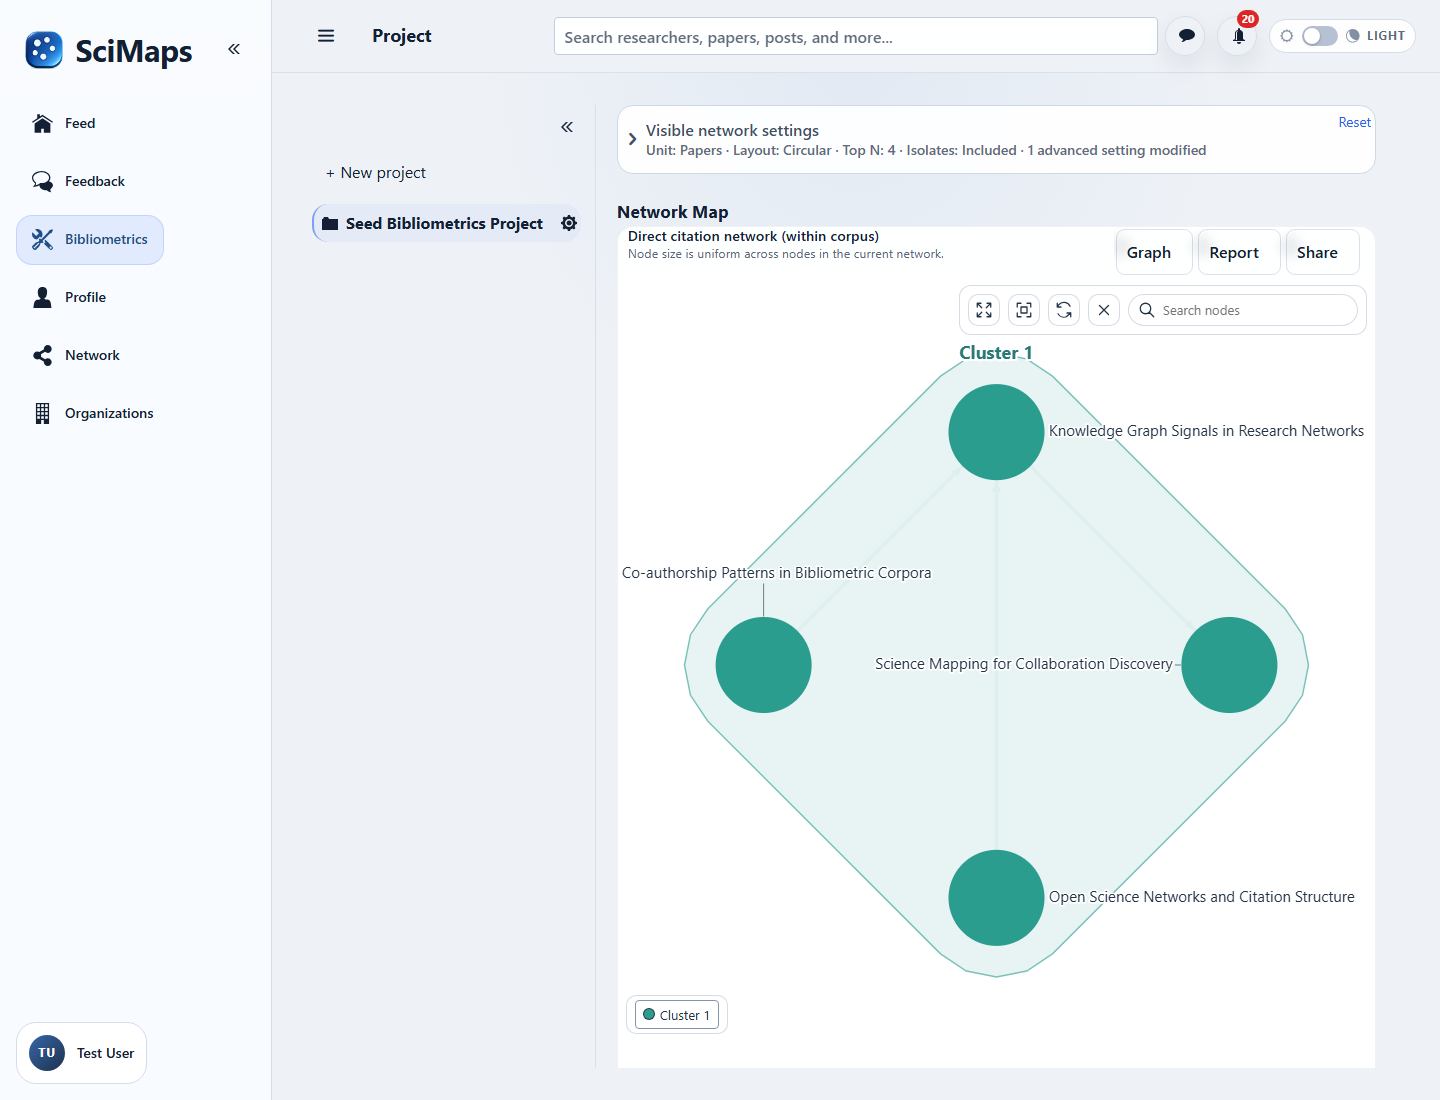
- SOURCE_01: Science Mapping for Collaboration Discovery (2021).
- SOURCE_02: Knowledge Graph Signals in Research Networks (2022).
- SOURCE_03: Co-authorship Patterns in Bibliometric Corpora (2023).
- SOURCE_04: Open Science Networks and Citation Structure (2024).
Download the four-source CSV and citation-list CSV. These describe the teaching corpus and its internal links; they are not an import package for the hosted application. The reproduction instructions explain how to open the matching seeded collection in a SciMaps development checkout.
Select exactly these four sources and open the direct-citation workflow. Use Papers, years 2021–2024, Top N nodes 4, Circular layout and Uniform node sizes. Keep Include isolates and Show arrows enabled; set Cluster filter and Edge scope to All and both minimum thresholds to 0.
The expected result is four nodes and three directed links: SOURCE_02 cites SOURCE_01; SOURCE_03 cites SOURCE_02; SOURCE_04 cites SOURCE_02. SOURCE_02 therefore has two incoming citations within this selected collection. This count describes the teaching graph, not its global citation count or scientific quality. References outside the selected four papers are outside this view.
Individual research example
A doctoral researcher selects a defined collection of 40 eligible urban-heat papers for a literature chapter. They use reference networks to locate readings and term networks to organize questions, then read the sources before writing the synthesis.
Institutional example
A library team selects a defined collection of 120 records meeting a documented topic, affiliation and year rule for a departmental workshop. The team compares themes and collaborations within those selected records. The result is a scoped discussion aid, not a complete institutional evaluation.
Limitations
Provider coverage, incomplete references, identity ambiguity, term variants and selection choices shape every result. Graph limits and thresholds can hide records or links. Describe the analyzed and visible scope separately when they differ. Counts and cluster size do not establish scientific quality; quantitative evidence needs contextual expert review.
References
- Hicks and colleagues (2015), Bibliometrics: The Leiden Manifesto for research metrics — principles for using indicators with expert judgement and transparent methods.
Related tools
Related guides
Try the workflow in SciMaps
Build a project collection and select the sources for your analysis.
Create an accountCreate your account, then complete verification to start using SciMaps. Already have access? Sign in to SciMaps.