
Organize and analyze
Thematic Map
Explore the structure of themes in a selected literature collection.
Create an accountCreate your account, then complete verification to start using SciMaps.
What you can explore
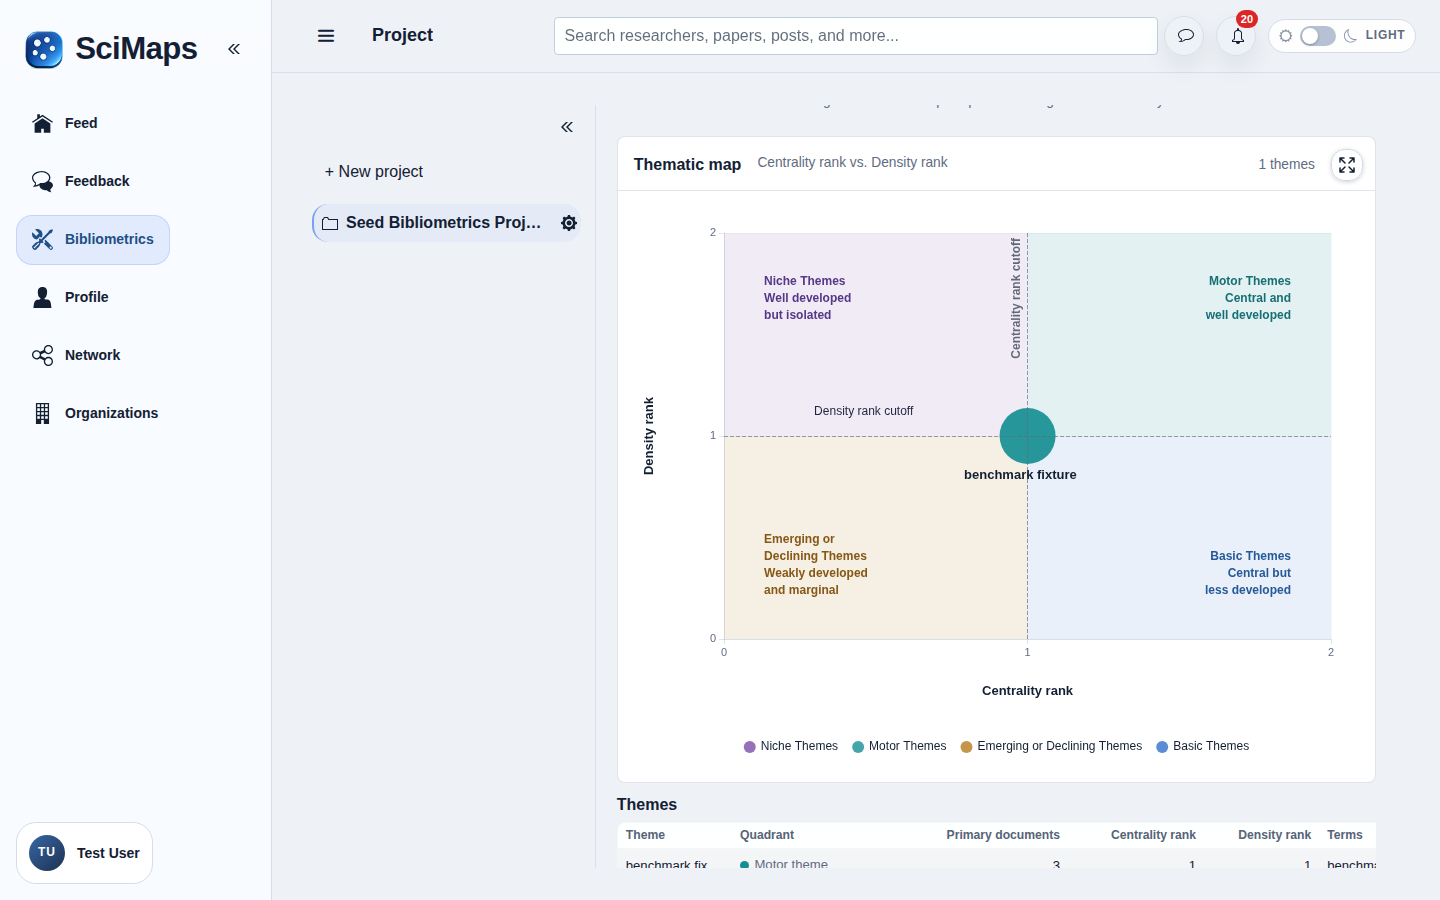
A thematic view positioning term clusters by their centrality and density within the analyzed network.
What you need
Selected project sources with usable terms for a term network.
How to use it
- Select the literature collection.
- Choose Thematic Map and review the available settings.
- Interpret theme positions alongside cluster terms and methodological notes.
Illustrative example
Suppose one term cluster has many connections to other clusters and strong connections among its own terms. Its horizontal position reflects centrality (external connectedness) and its vertical position reflects density (internal cohesion). Other clusters provide the comparison baseline. Term coverage, thresholds and settings can move a cluster; quadrant labels do not establish importance or forecast growth.
Interpretation and limitations
Cluster placement depends on term coverage, thresholds and method settings. Quadrants are contextual descriptions, not forecasts of future importance. Results describe the selected sources and available metadata; they do not represent all research in a field.
Related tools
Related guides
Create an accountCreate your account, then complete verification to start using SciMaps. Already have access? Sign in to SciMaps.