
SciMaps guide
Keyword Co-occurrence Networks and Thematic Mapping
Published by SciMaps · Updated
Read keyword co-occurrence networks and thematic maps: term preparation, thresholds, centrality, density and contextual quadrants.
From terms to a map of themes
A keyword co-occurrence network connects terms that occur in the same analyzed records. Terms are nodes and co-occurrences are links. A thematic map summarizes clusters in a term network using centrality and density. The two views describe vocabulary and network structure within the selected collection.
Prepare the collection and record the settings
- Define the question and select the eligible project sources. Review whether keyword or term metadata is present.
- Inspect term variants such as abbreviations, spelling and singular/plural forms. Record how terms were prepared and normalized. Review source metadata and available settings; this guide does not assume an in-app thesaurus editor or automatic data-cleaning controls.
- Open Keyword Co-occurrence. Review available frequency and link thresholds, then inspect term context.
- Open Thematic Map and compare cluster terms, supporting papers and method notes. Document settings so comparisons use a consistent basis.
Illustrative example
Suppose three selected records contain “climate change” and “adaptation,” and one contains “heat island.” The first two terms have a co-occurrence link. A minimum frequency of two would exclude “heat island” in this invented example, if that threshold were used. Exclusion means it falls below the selected threshold, not that it is scientifically unimportant.
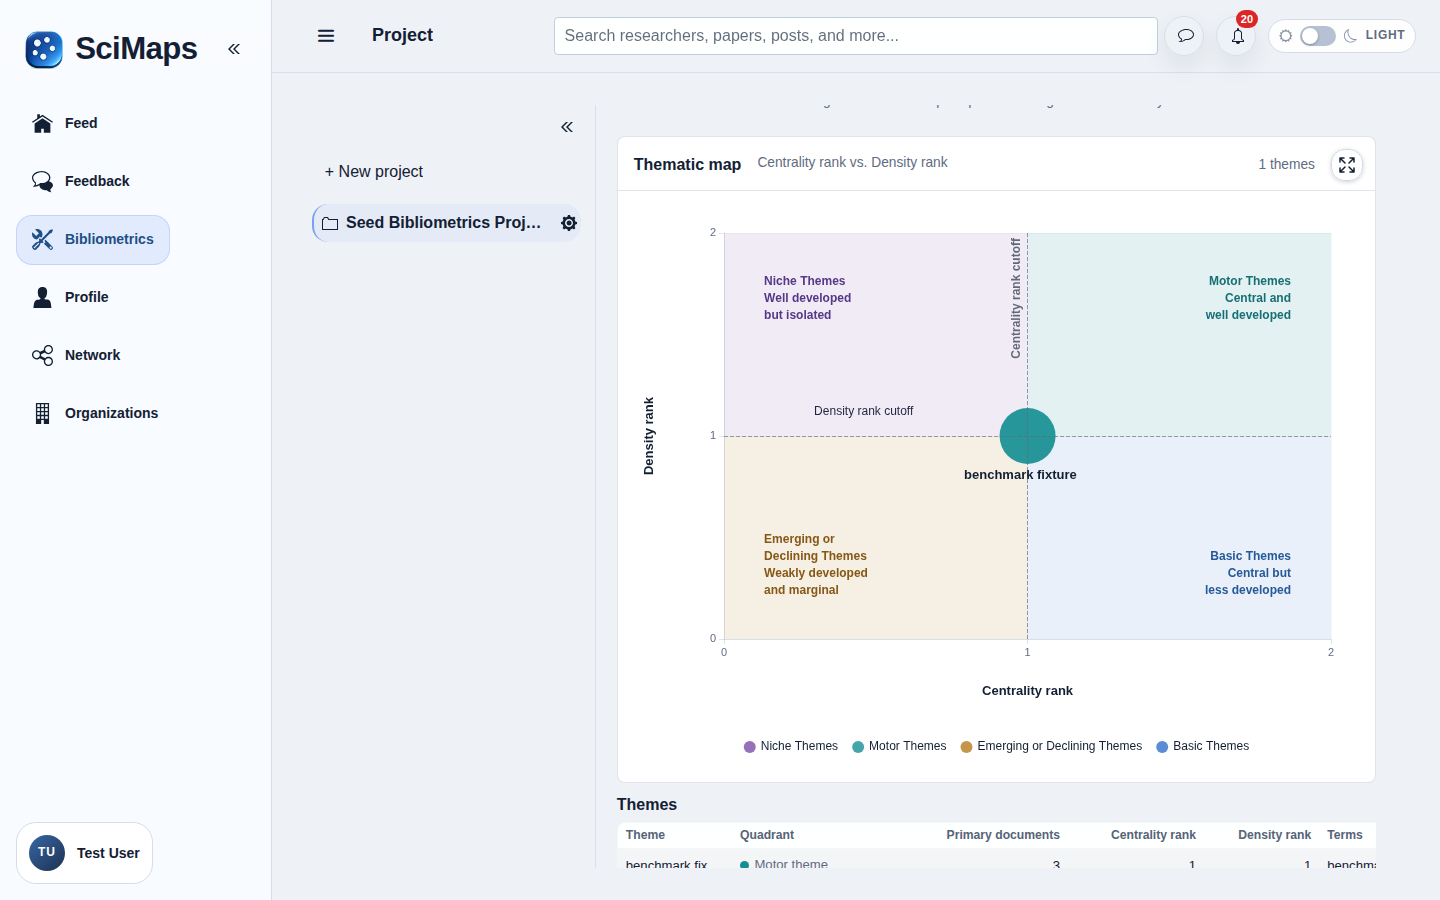
Now imagine an “adaptation” cluster connected to many other clusters and tightly linked internally. On the thematic map, the horizontal axis is centrality: external connectedness to other themes. The vertical axis is density: internal cohesion among its terms. Both are relative to the analyzed network and method settings, not universal scores.
Read quadrants in context
- High centrality and high density: often labelled motor themes, connected externally and cohesive internally.
- Low centrality and high density: often labelled niche themes, cohesive but less connected to other themes.
- High centrality and low density: often labelled basic or transversal themes, connected broadly with lower internal cohesion.
- Low centrality and low density: often labelled emerging or declining themes. A single snapshot cannot distinguish emergence from decline.
Check the map's actual dividing lines and calculation notes. A quadrant is a structural description. It is not a ranking of importance, a forecast or proof of research maturity.
Individual research example
A researcher selects a defined collection of 80 eligible adaptation papers. They inspect frequent terms and supporting papers to organize a reading outline, checking whether abbreviations split the vocabulary before interpreting clusters.
Institutional example
A research-office team selects a defined collection of 180 publications in a stated topic and period for a seminar. They use cluster positions to ask questions about this selected collection, not to rank departments or claim complete institutional coverage.
Limitations
Term availability, extraction, normalization, thresholds, clustering and collection size all affect the map. Distinct concepts can share a label; equivalent concepts can have different labels. Compare settings and supporting evidence before describing change. AI Insights is not an available tab for Thematic Map or Trends.
References
- Callon and colleagues (1983), From translations to problematic networks: An introduction to co-word analysis.
- Callon, Courtial and Laville (1991), Co-word analysis as a tool for describing the network of interactions between basic and technological research.
Related tools
Related guides
Try the workflow in SciMaps
Build a project collection and select the sources for your analysis.
Create an accountCreate your account, then complete verification to start using SciMaps. Already have access? Sign in to SciMaps.